Open-source dev-tools

7 small tools, one constraint: they have to work in a room where you can't install anything and the data can't leave. Browser-only, BYOK, no backend — not a stylistic choice, just what's left when the environment isn't yours.

Six of them make the Claude API legible — observe a single call, replay an agent trace, compare prompts side by side, build a tool-use loop interactively, pre-flight a prompt before you send it, stress a structured-output contract until it breaks. The seventh does the same for a page's performance budget: simulate what removing a script would actually cost, before you spend a sprint finding out.
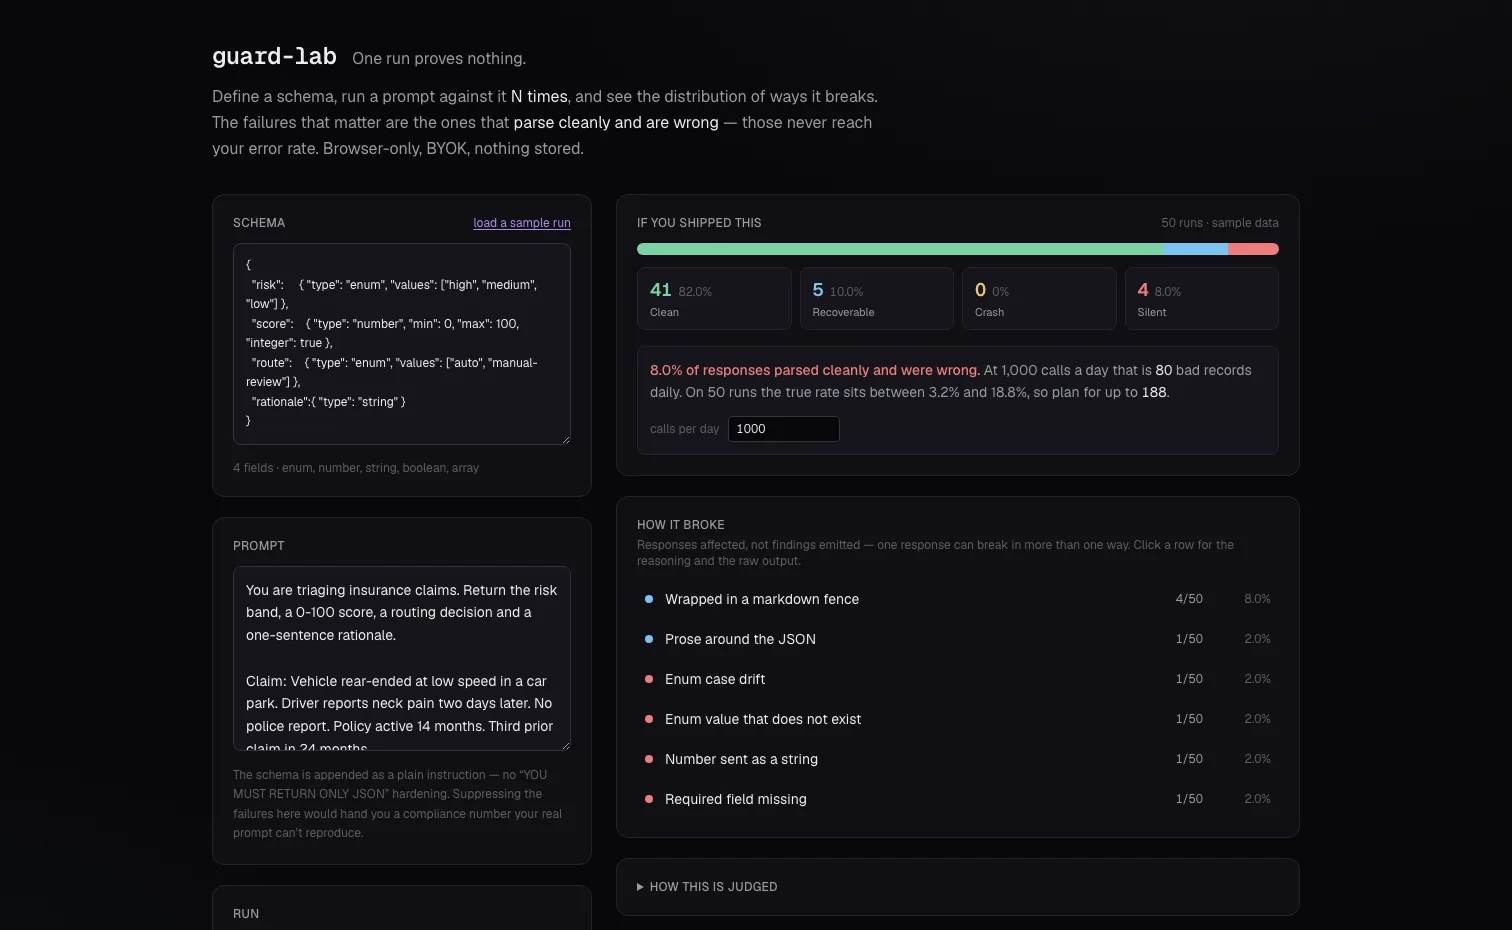
guard-lab screenshot

guard-lab

Run a prompt N times against a schema and see how it breaks — especially the failures that parse cleanly and are wrong.

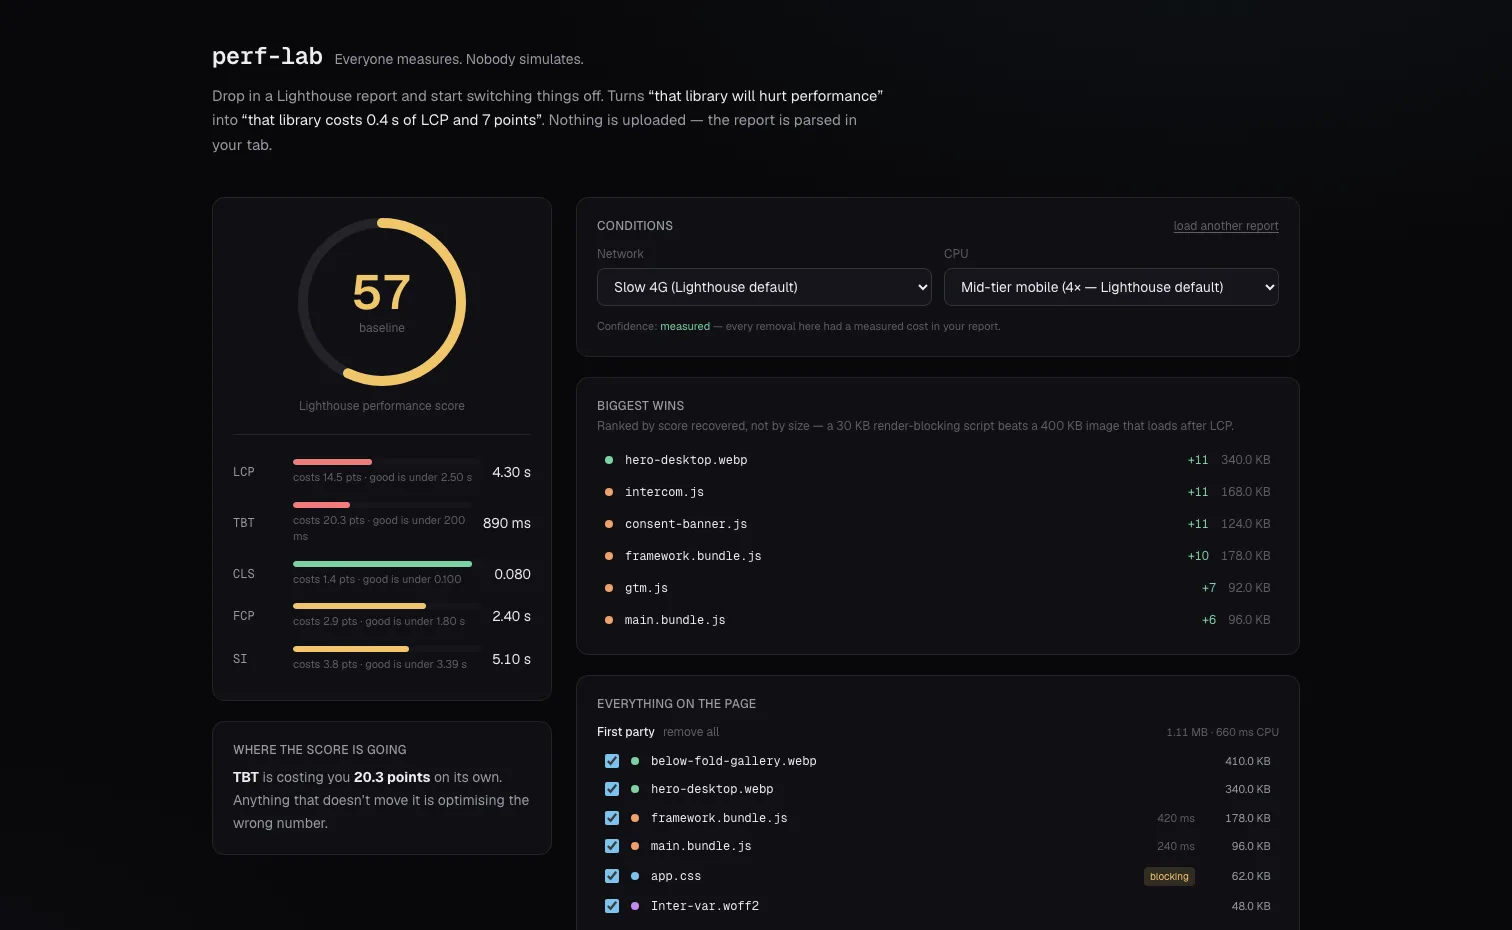
perf-lab screenshot

perf-lab

Turn “that library will hurt performance” into “that library costs 0.4s of LCP and 7 points”.

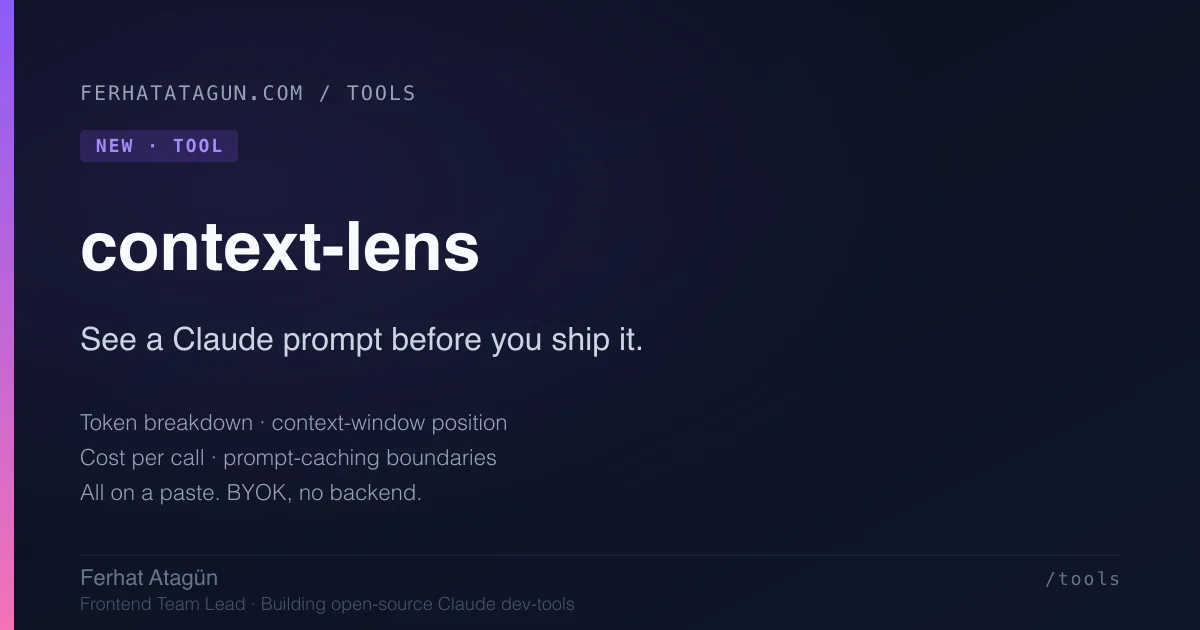
context-lens screenshot

context-lens

See a Claude prompt before you ship it — tokens, context-window position, cost, caching boundaries.

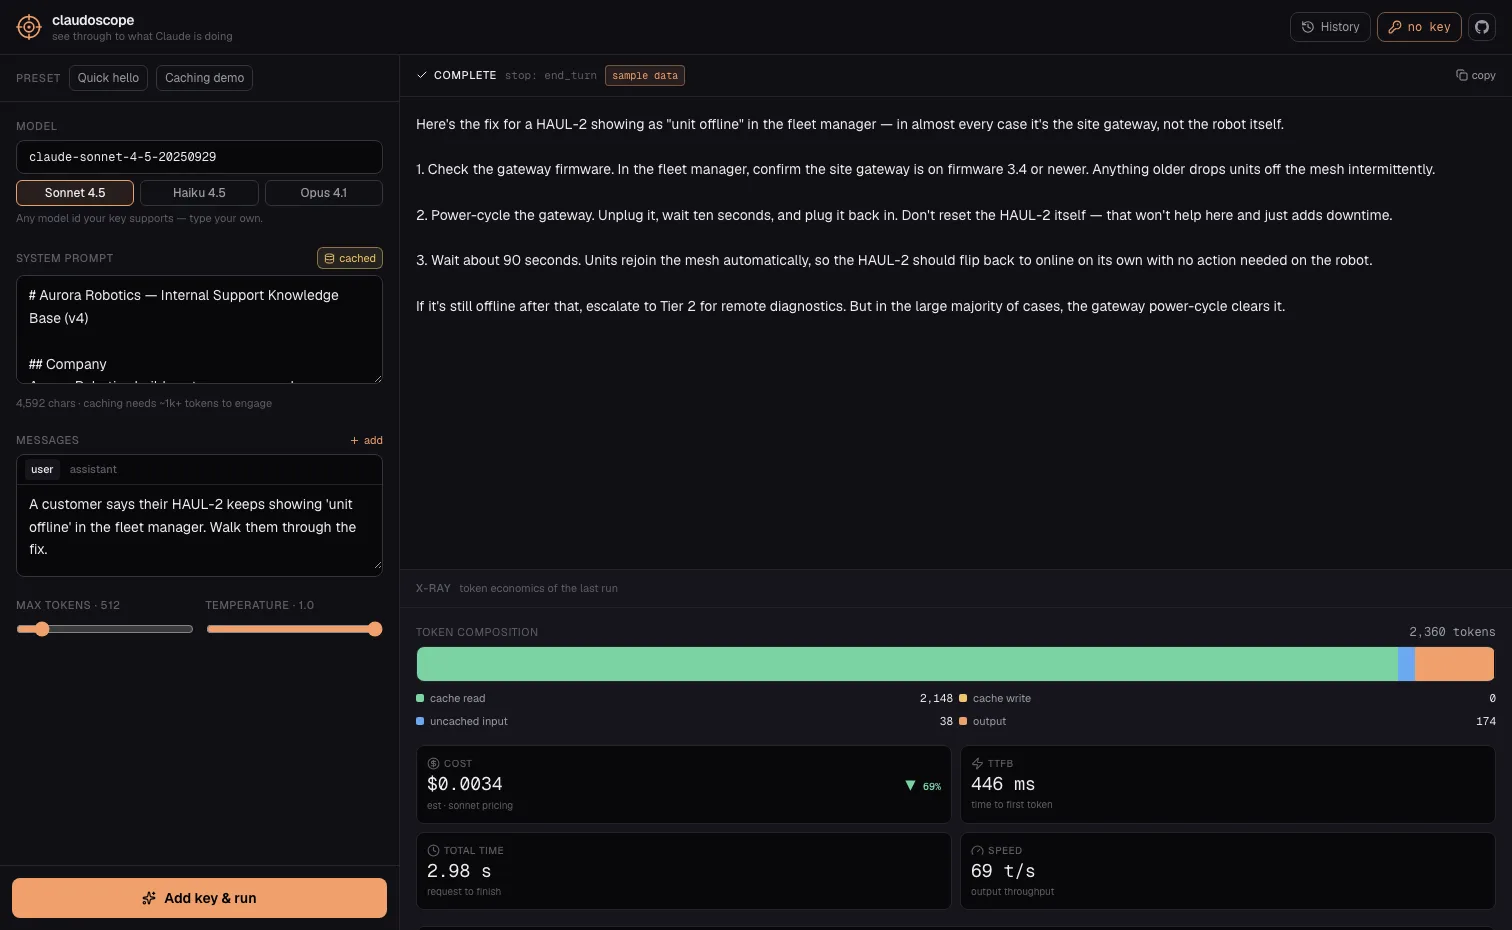
claudoscope screenshot

claudoscope

X-ray your Claude API calls: prompt caching, tokens and cost, visualized live.

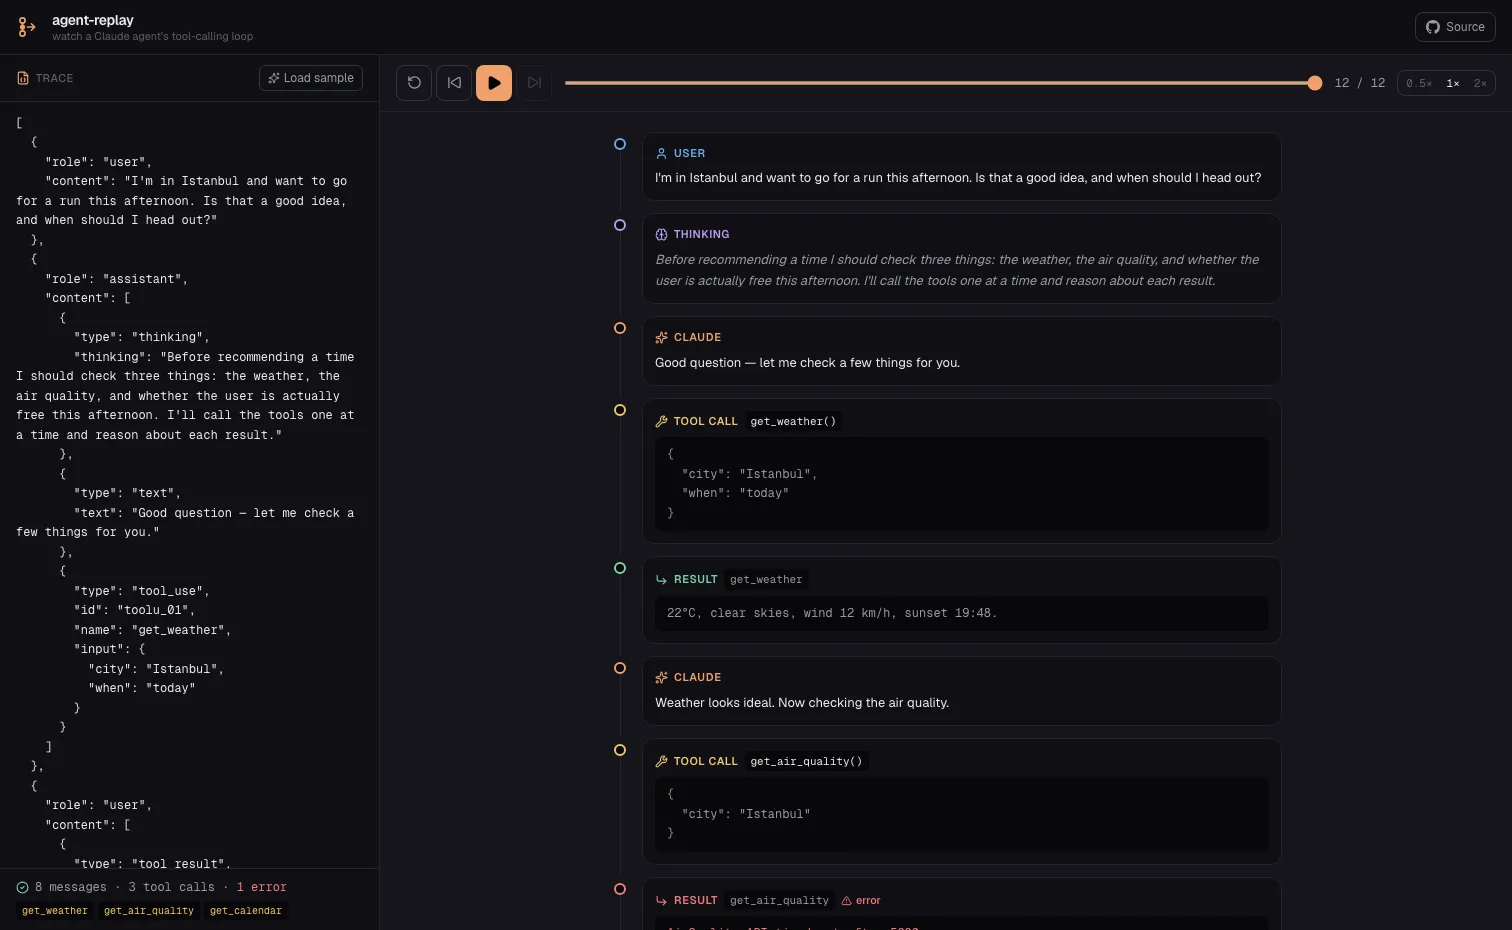
agent-replay screenshot

agent-replay

Replay a Claude agent's tool-calling loop, step by step on a cinematic timeline.

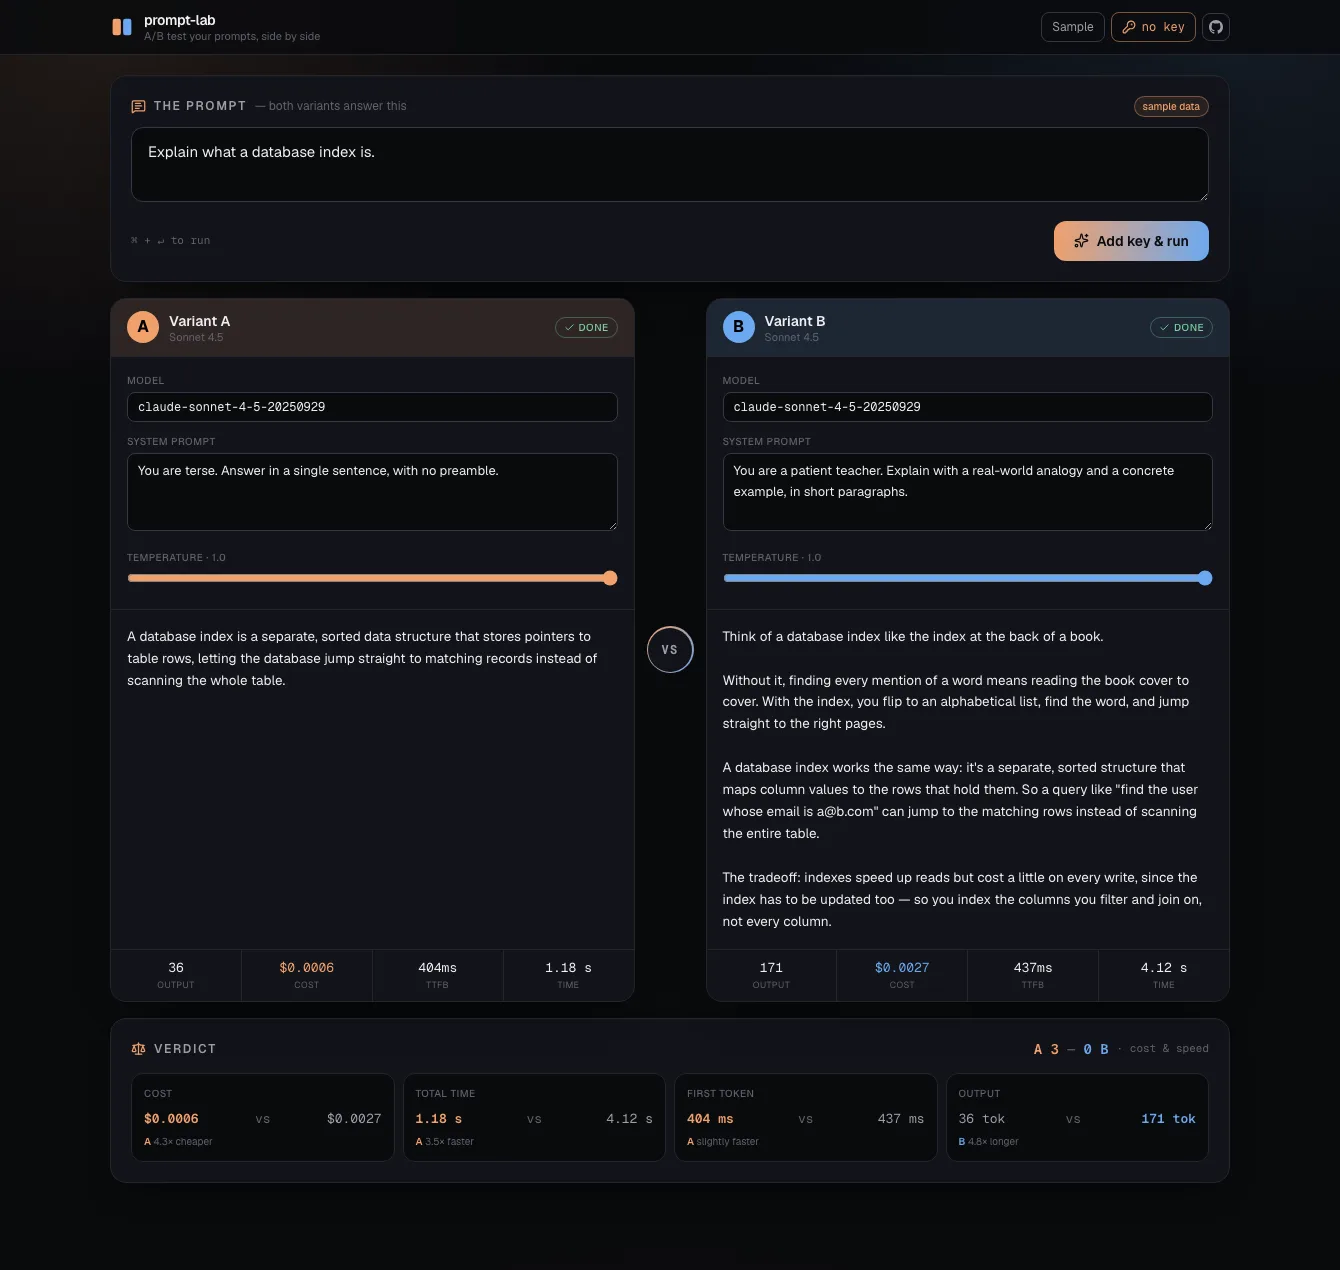
prompt-lab screenshot

prompt-lab

A/B test your Claude prompts side by side — output, cost and latency, compared.

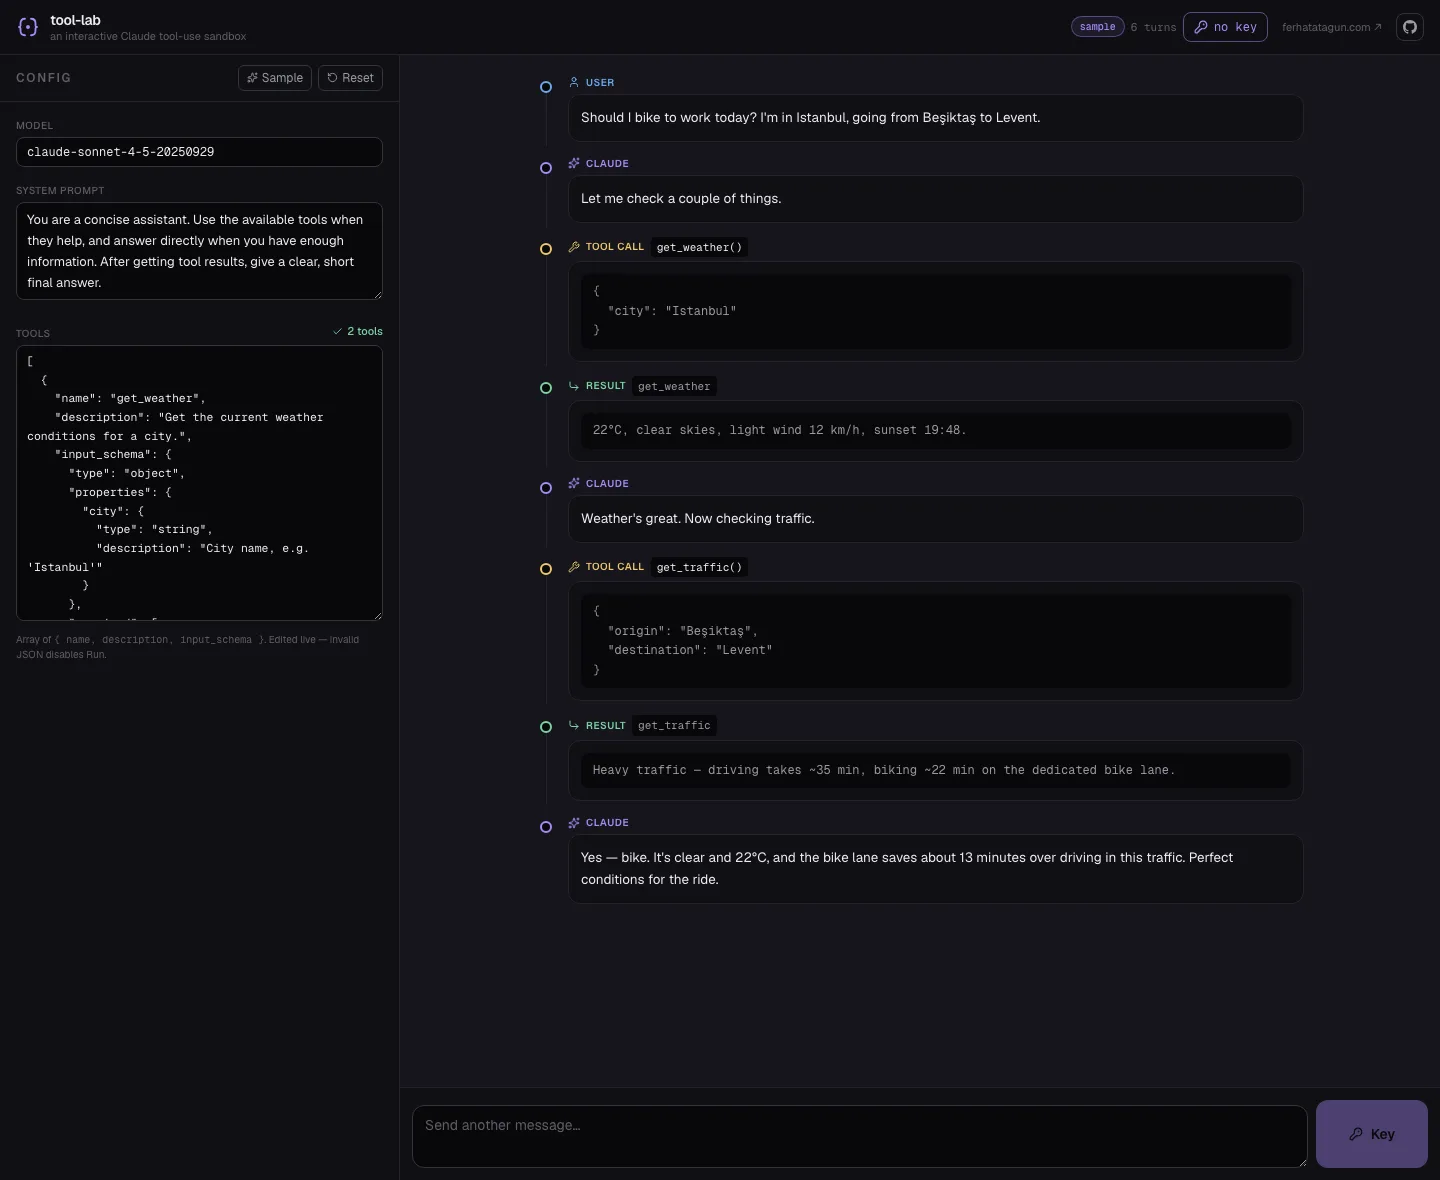
tool-lab screenshot

tool-lab

Interactive Claude tool-use sandbox — define tools, mock responses, watch the agent loop live.

Read the writing

Each tool has one or two long-form posts explaining the engineering decision behind it — the protocol-level details, the failure modes it surfaces, and what it changes about how you ship.